
Jul 08, 2024
The Future Is Now - 8 Breakthrough Technologies Of 2024
Every year, there are new technologies that make a difference in the world. 2024 is turning out to be amazing …

Do you have a feeling that your app marketing campaigns could perform better but you’re not sure how?
You might be lacking a compass to guide you in the right direction, which for most successful app marketers are their metrics.
By measuring the right KPI’s, you can gain valuable insights into your app marketing performance and make data driven decisions to improve your strategy.
So you’re not just basing everything you do on pure instinct.
But I get it, there are a lot of metrics out there which can make it hard to choose the right ones and leave you feeling overwhelmed.
In this article, I’m going to tell you the most vital app marketing metrics you should be measuring right now to improve your marketing campaign performance. I’ll tell you exactly what metrics to follow, how to use them and when, so you can improve your results in every stage of your campaign lifecycle.

So lets start with acquisition. The two key metrics that are critical to measure at this stage are cost per install and click to install.
In a nutshell, cost per install, or CPI, is the price you pay a publisher for every user that installs your app after engaging with their ad.
And as long as the attribution logic determines that, lets say in one month you spent $5,000 each on two different Facebook ad campaigns. One campaign generated 1500 installs and the other brought you 1000 installs. Divide the amount you spent on each campaign by the number of installs it generated.
This would give you an effective CPI of 3.3 for the first campaign and $5 for the second.
CPI is an essential metric as it tells you which campaigns were more costly than others and most importantly, it helps you to determine your overall return on ad spend which were going to cover later on in this article.
The second key acquisition metric is click to install or CTI.
CTI is the share of users who clicked on an ad and then went on to install your app from the App Store.
Measuring the direct conversion of the two strongest touch points on a users preinstall journey helps you to understand, if you’re reaching the relevant audience, how your creatives are landing, and the effect of your app store page.
But hold up, it doesn’t end there.
One in two apps are uninstalled within the first 30 days of being downloaded.
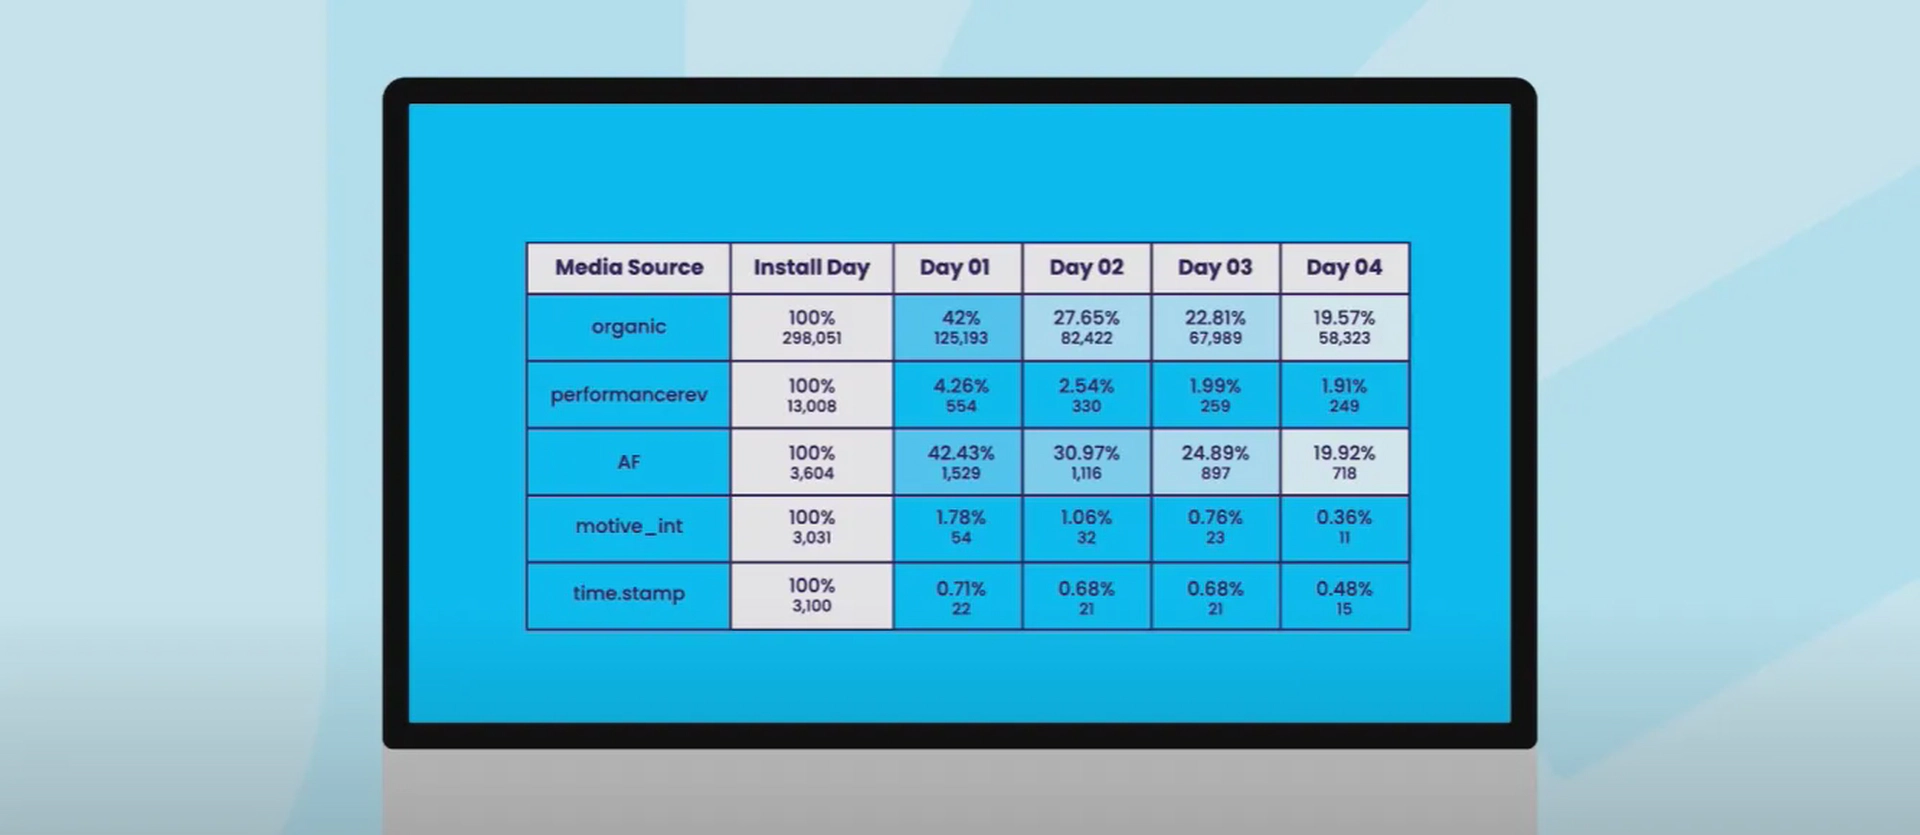
So as well as looking at your install numbers, it’s even more important to analyze what actions users take after users install your app and how much revenue they generated.
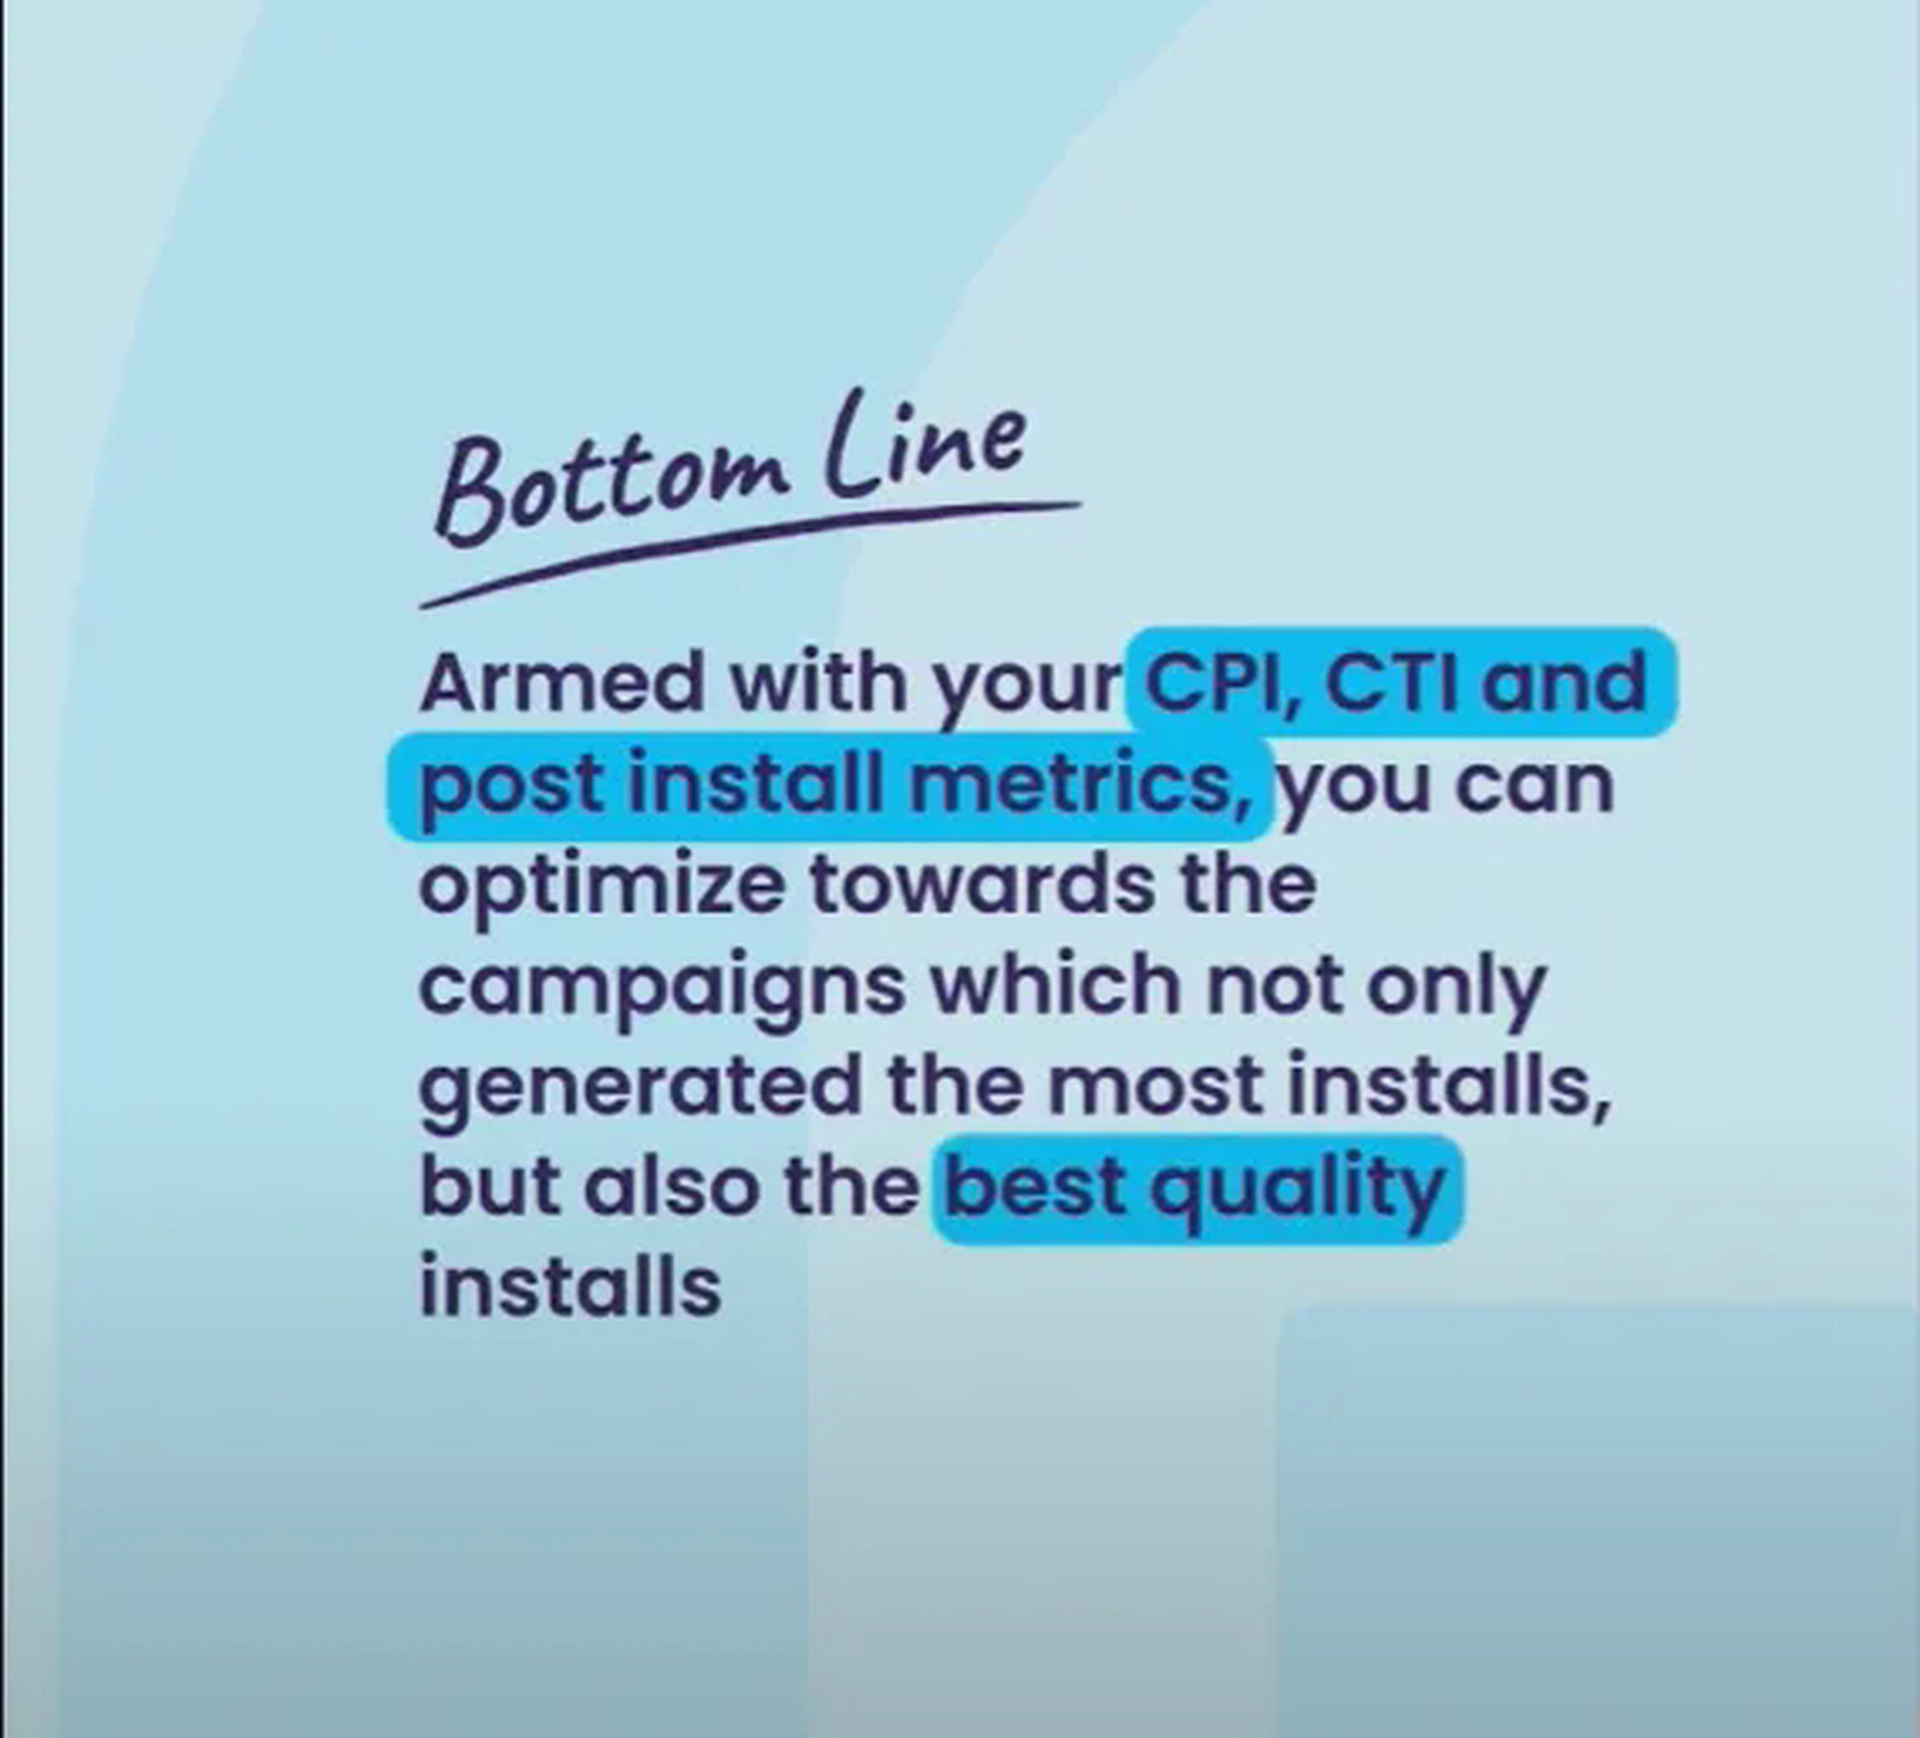
Armed with your CPI, CTI and post install metrics, you can optimize towards the campaigns which not only generated the most installs, but also the best quality installs users who end up engaging with and ultimately driving real revenue using your app. Which leads us to our next group of metrics which will help you to improve user engagement.
One of the key routes to app marketing success is understanding how you can keep your users once you’ve got them, especially as it’s at least five times cheaper to retain an existing user than it is to acquire a new one.
The first metric is active users. These are the number of unique visitors who engage with your app during a specific period of time.
The two most common timeframes are daily and monthly DAU or MAU.
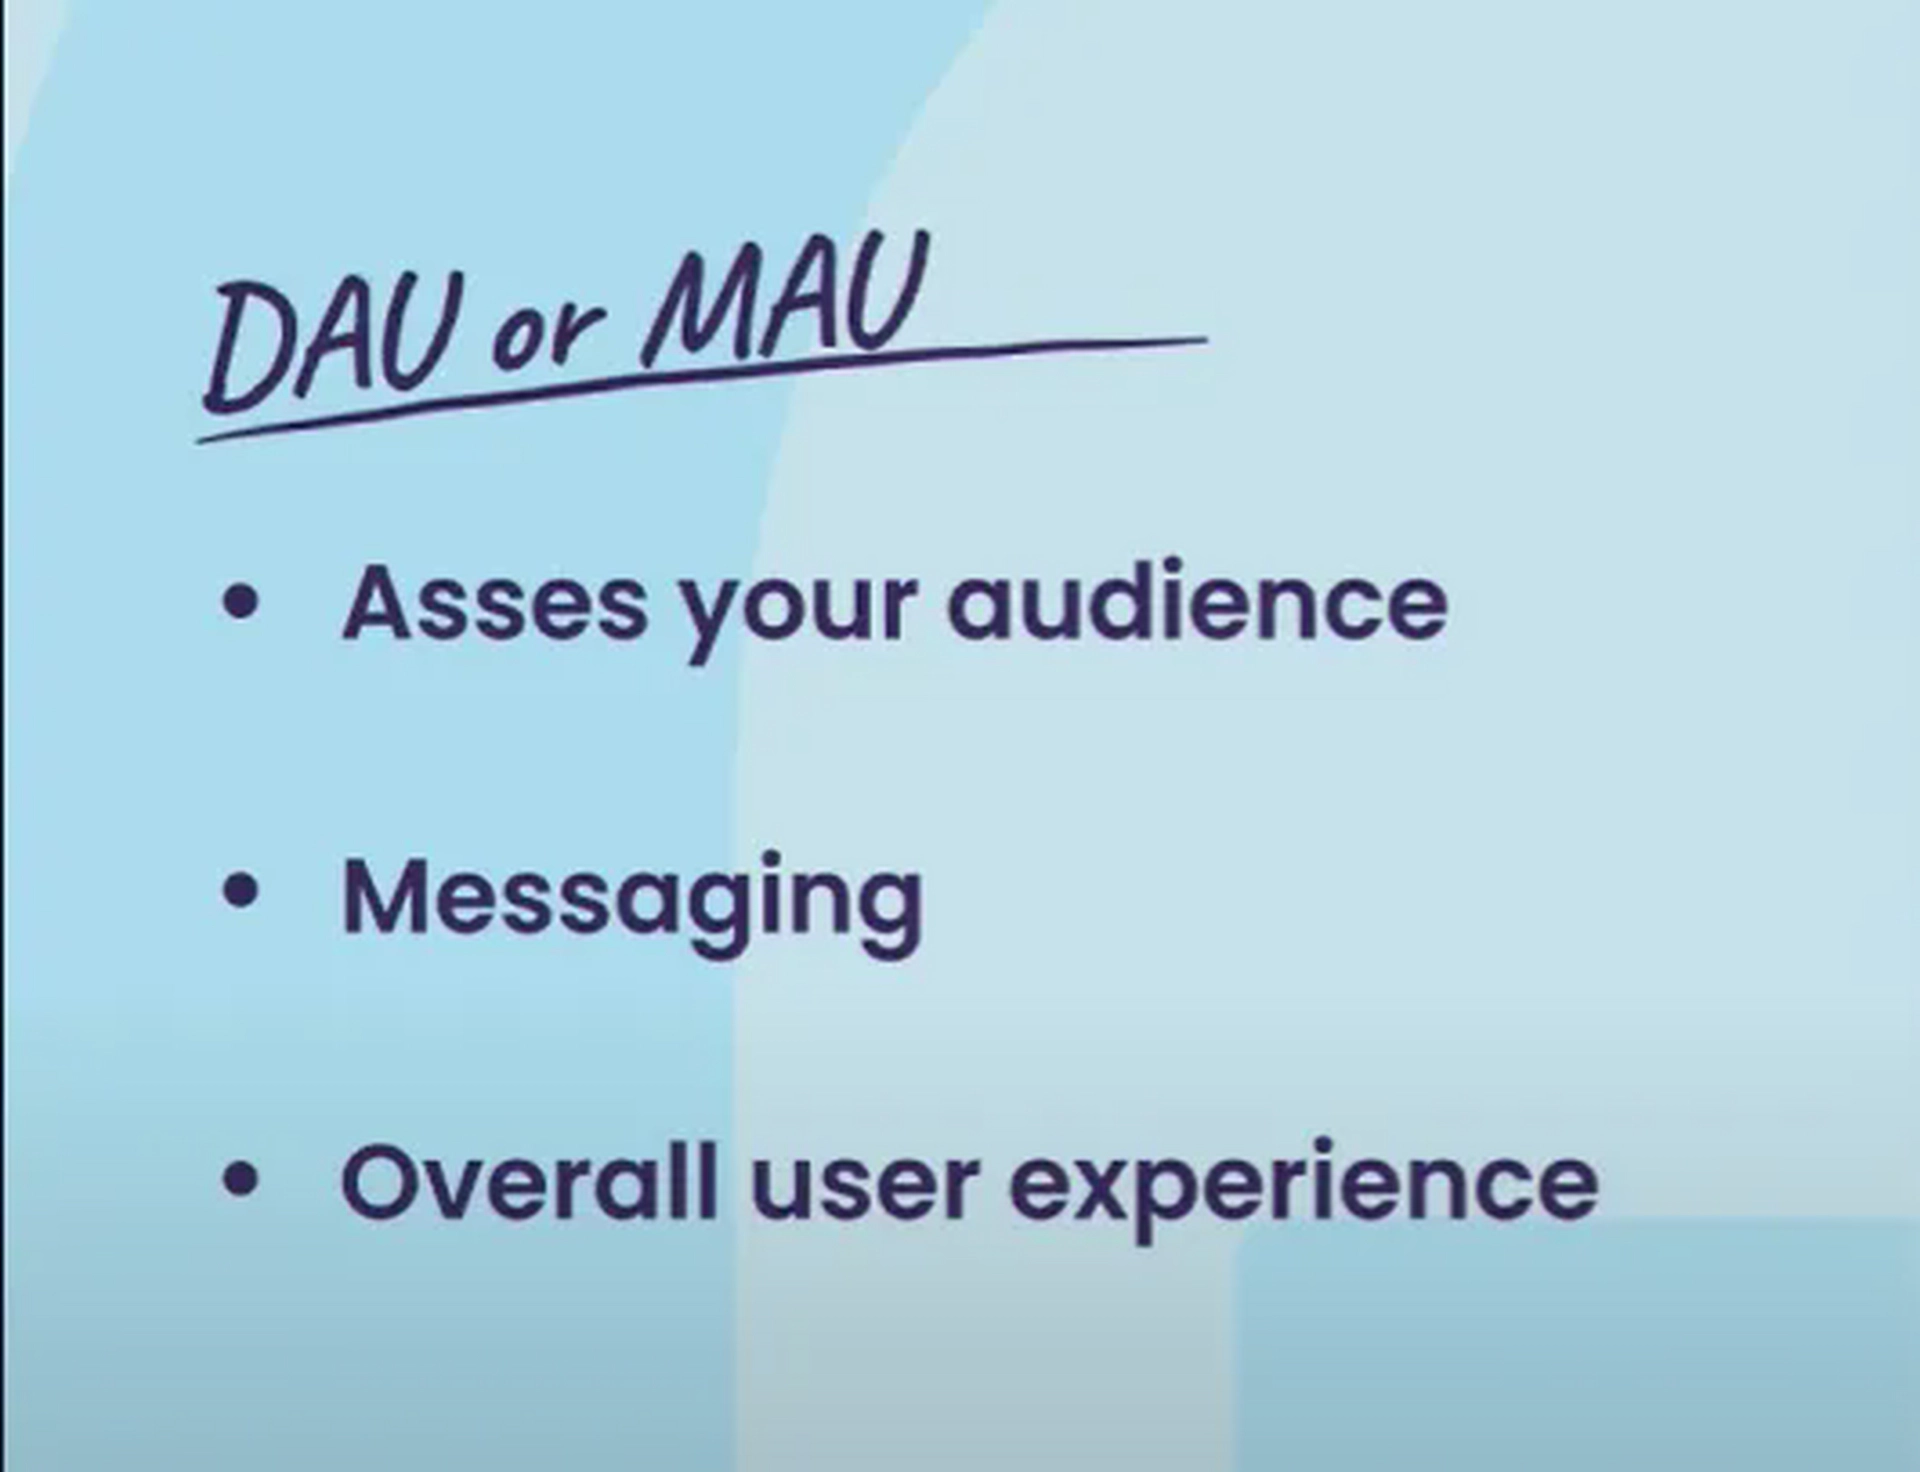
Daily or monthly active users will help you assess whether your marketing campaigns reach the right audience with the right messaging as well as your overall user experience.
If you’ve got low numbers of active users, start analyzing all your customer touch points pre and post install.
Say your finance app was successful in driving more installs, but then you got a high churn rate.
You want to figure out what worked in your campaign and which features in app seem to be turning your users off.
The second metric calculates the average number of sessions initiated by each app user and is mainly used to determine how frequently users return to your app in a set timeframe.
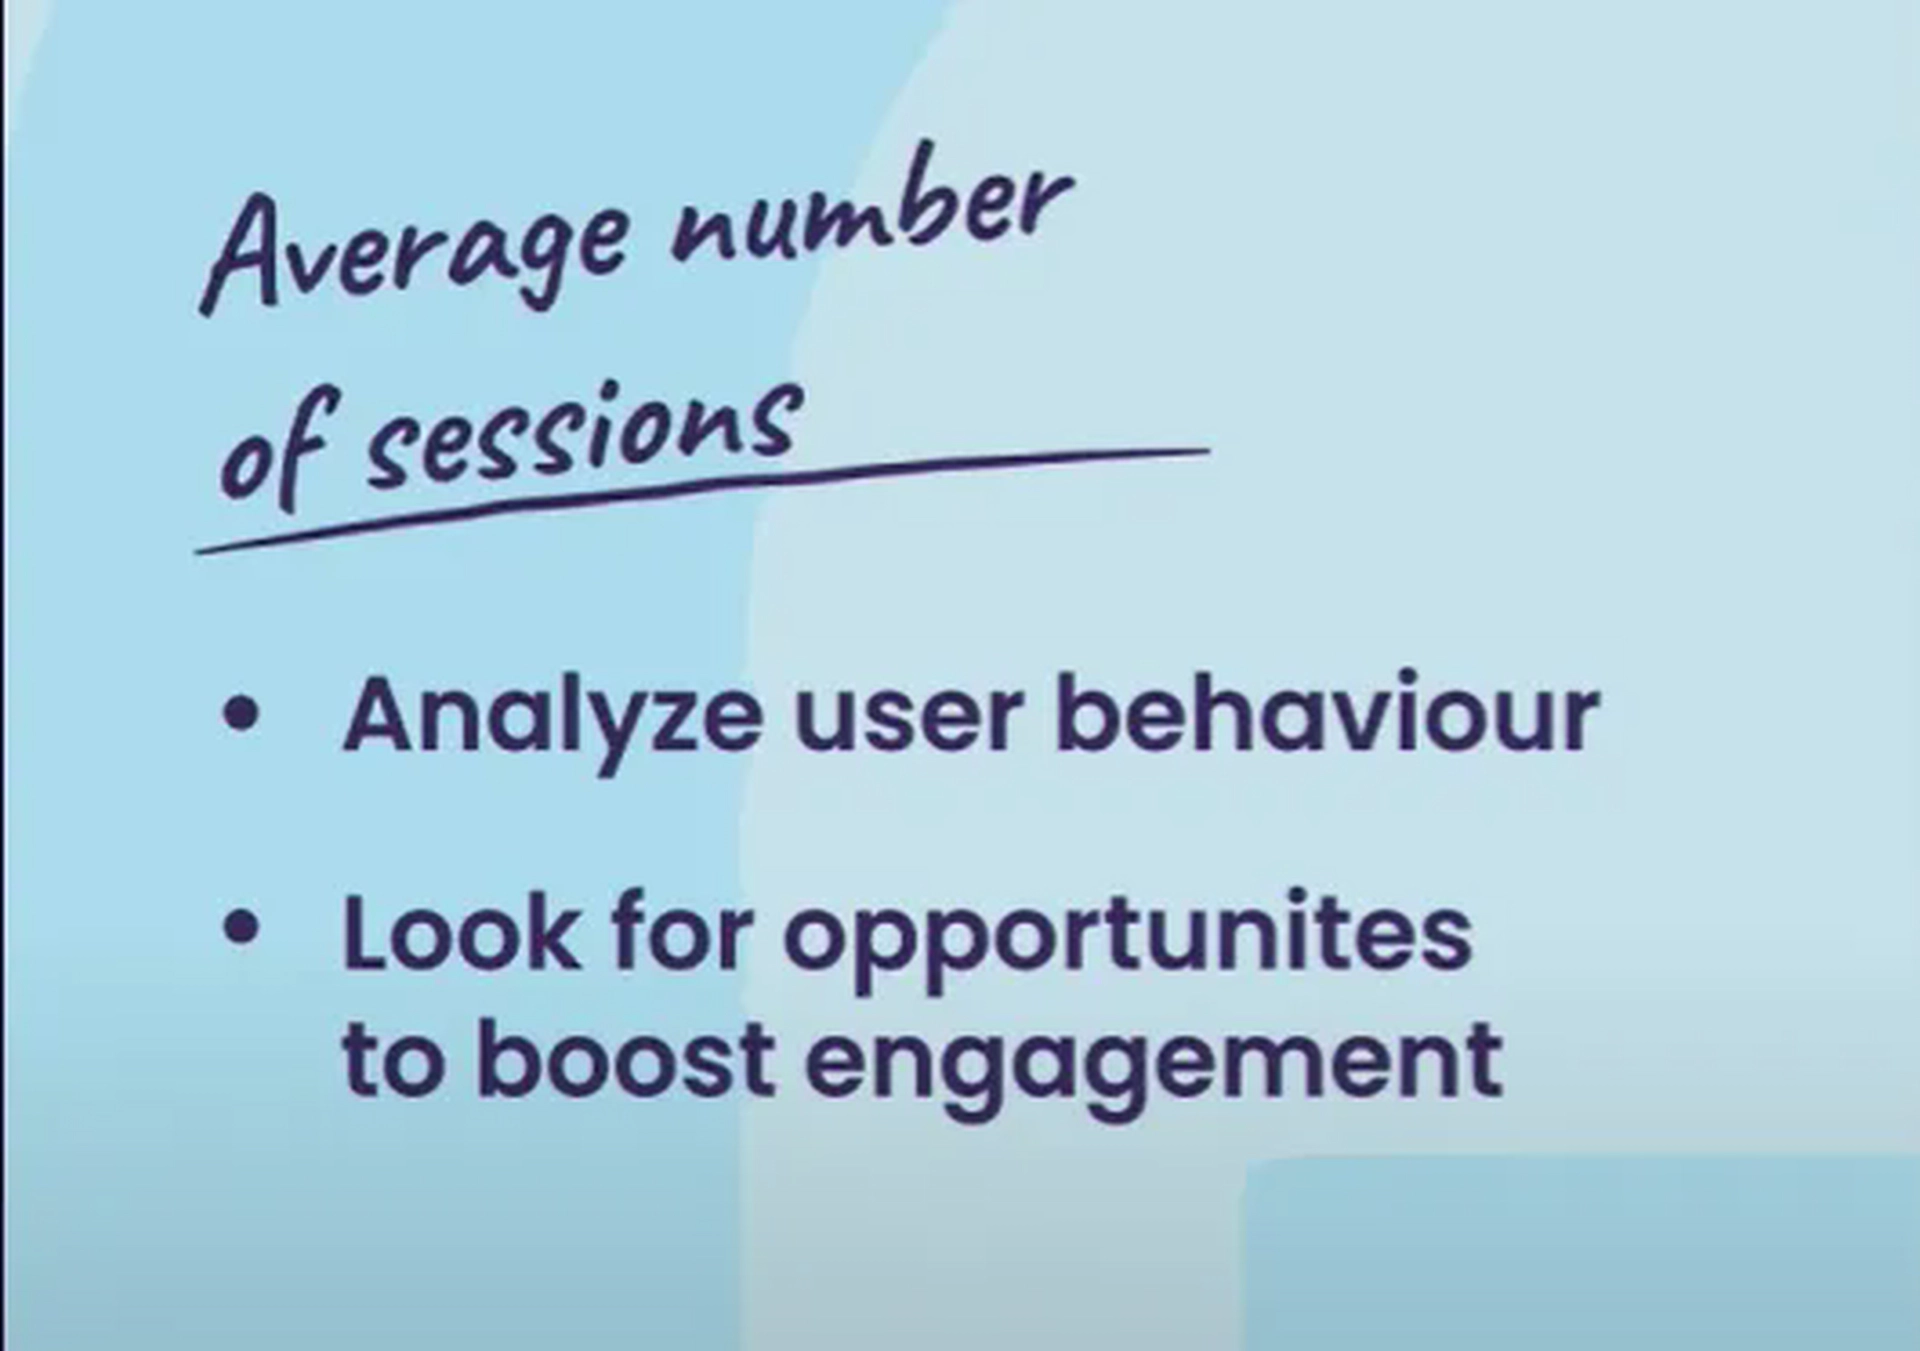
You can use it to analyze your users behaviour and see what might need optimizing to boost engagement.
The third essential engagement metric is your retention rate.
Simply put, this is the number of returning users after a given time period.
The average global retention rate is only four to 5% by day 30, so it’s super important to mitigate against low rates, especially as it’s a key source of monetization, why frequent or consistent users are more likely to make in app purchases and drive higher in app revenue.
Analyze your retention metrics to see how well your app is performing and where you need to make improvements.
For example, if you’re a gaming app and your users churn after onboarding, you’ve already identified a key area for improvement.
And fourth is uninstall rate.
I know you don’t want to think about it, but this the rate at which users uninstall your app within a predefined window is high across all industries. Uninstall rate data will give you a key insight into whether your app is delivering what your users expect. If your uninstall rate is high, it may mean there was something misleading in your campaign messaging or that your onboarding process needs to be more straightforward.
Bottom line if you understand why people are uninstalling your app, you can figure out where the gap or issue is and optimize from there. Great. Now your user acquisition and engagement metrics are in place.
We’re going to go through the key revenue metrics so we know marketing matters, but sometimes it’s hard to prove it, which is why these revenue metrics are crucial to show the profitability of your campaigns. So let’s break it down.
First, return on ad spend ROAS calculates the effectiveness of a campaign for generating return by comparing the amount of revenue made to the amount spent on the campaign.
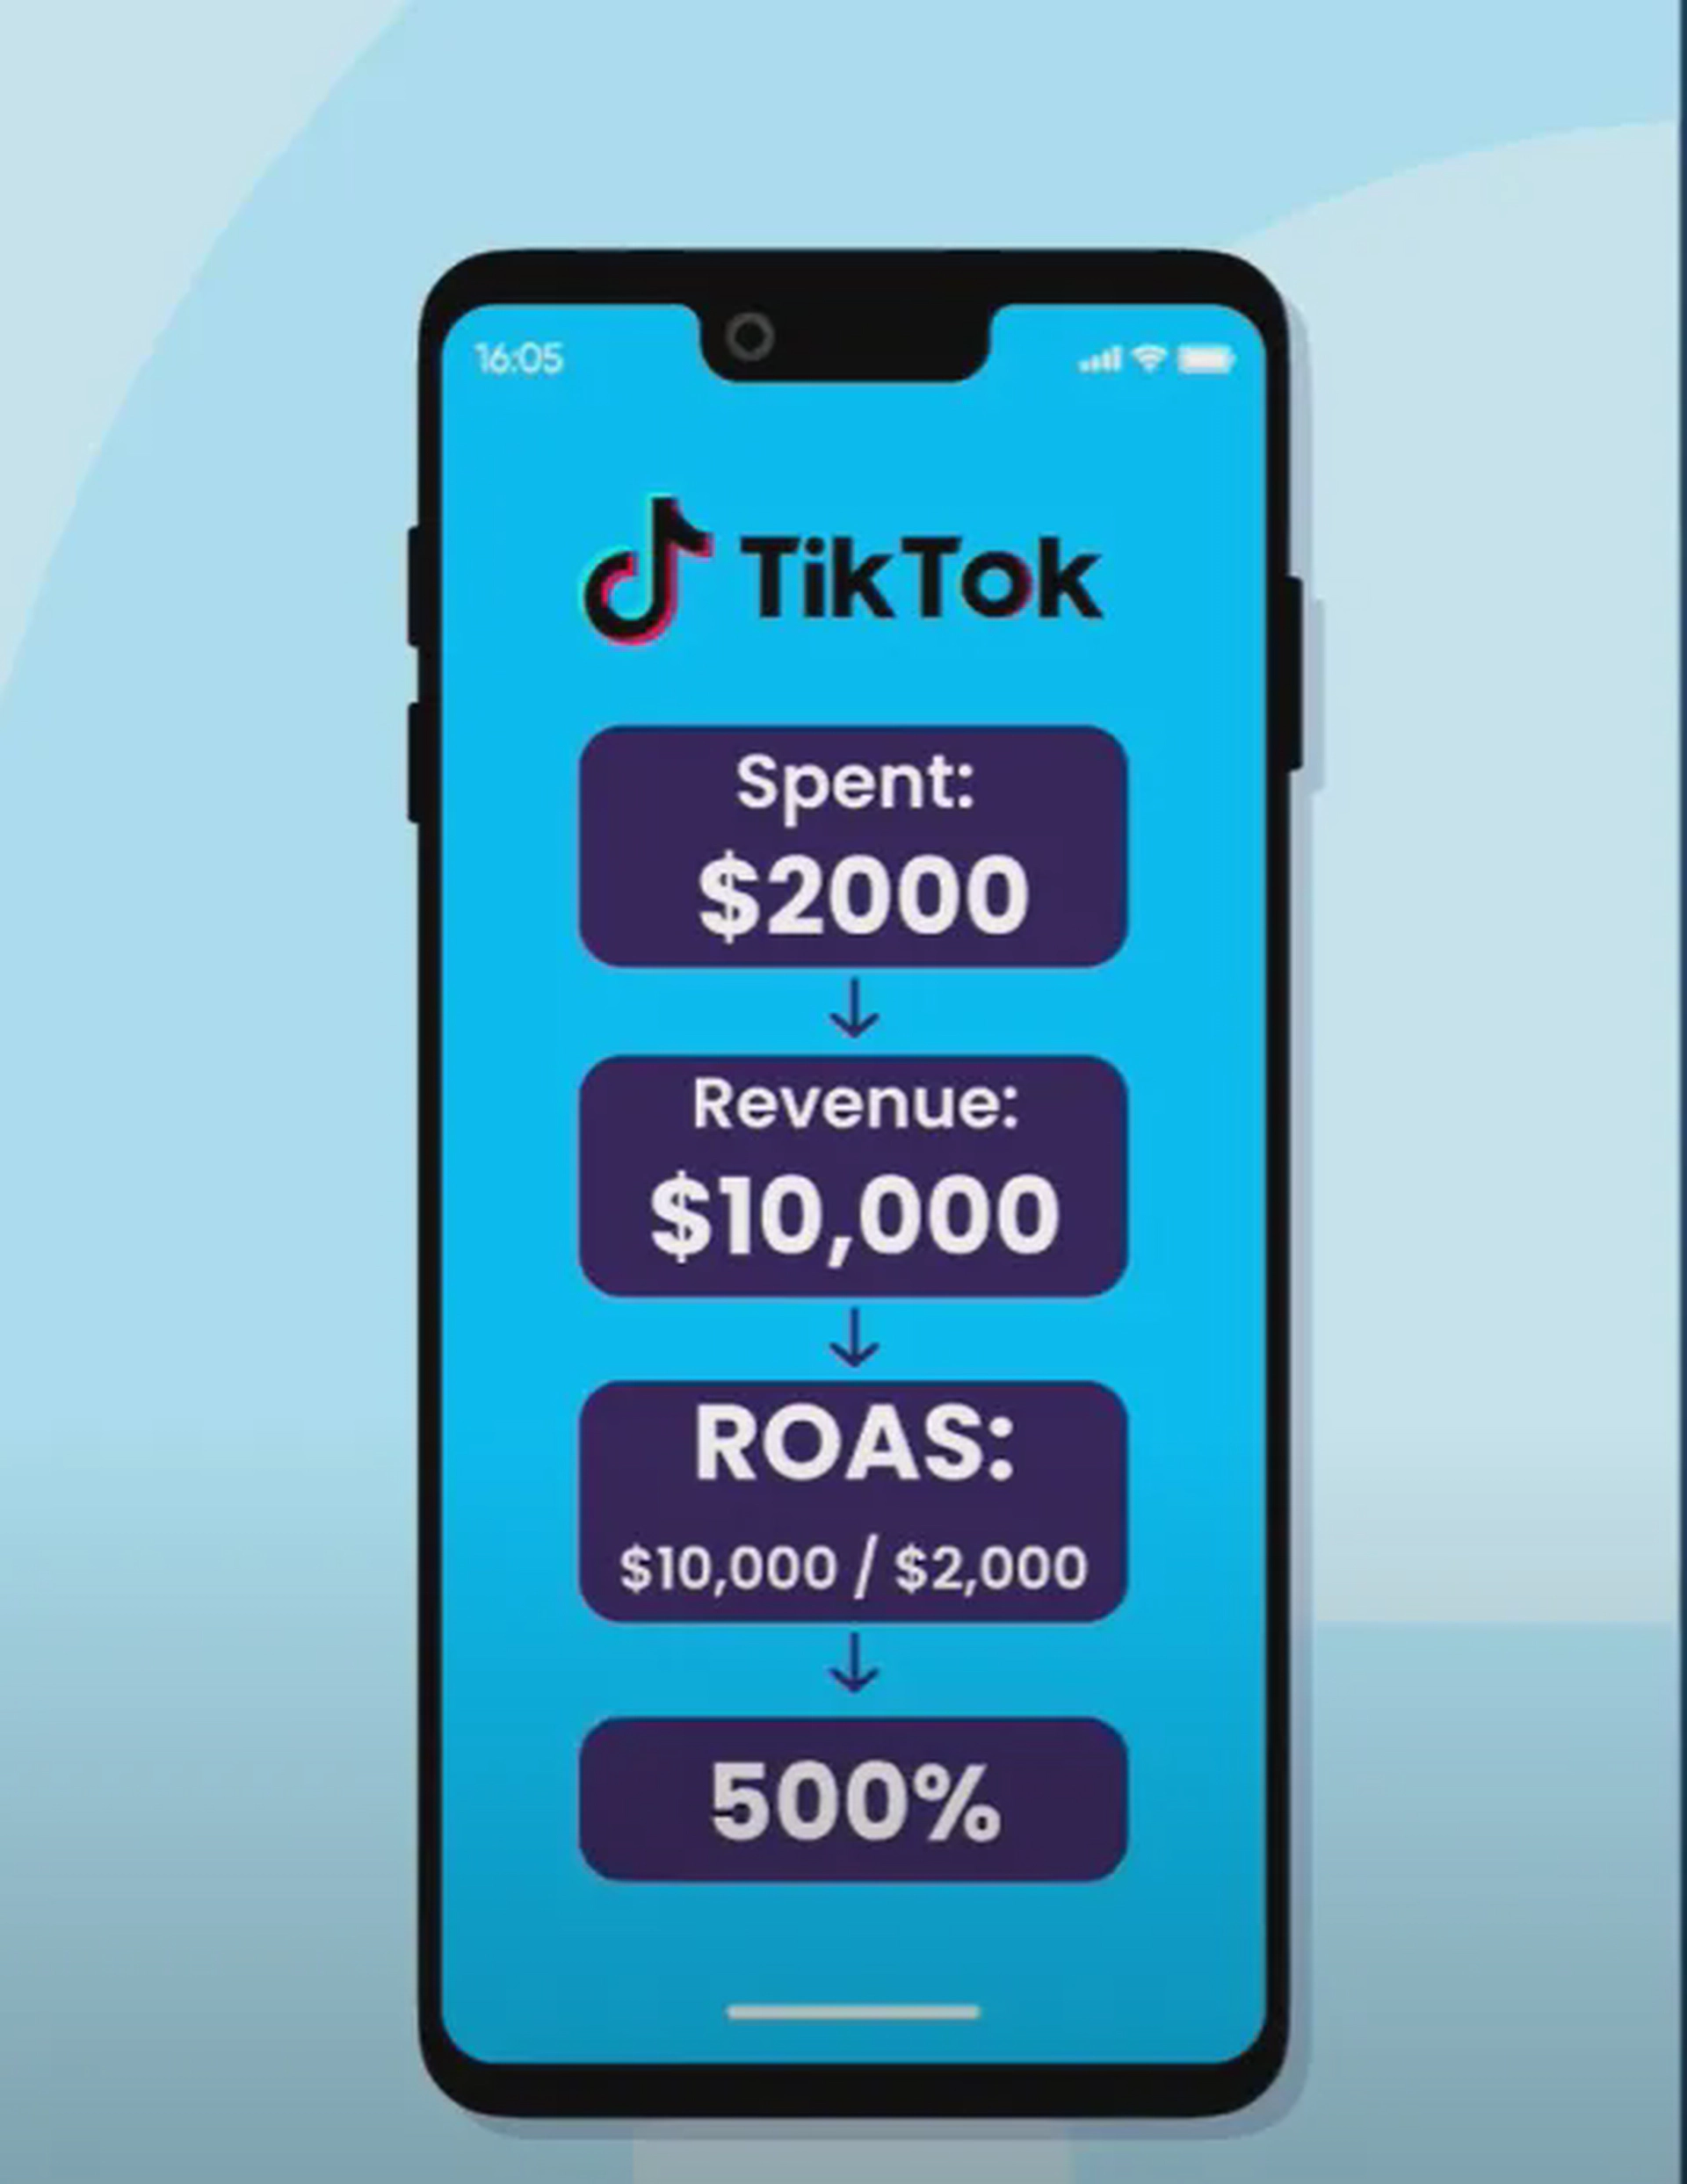
It’s one of the most important metrics for app marketers because it shows you which campaigns are actually making you money. Say you spent $2,000 on a TikTok ad campaign for your shopping app and it generated $10,000 in revenue.
You take your total revenue $10,000 and divide it by your total ad spend $2,000, giving you a ROAS of 500%.
But remember to truly know if you’re making a profit. You also need to know what your breakeven point is and then work out your profit margin.
Install to purchase conversion rate, also known as your share of paying users.
This is the percentage of users who installed your app and went on to make an in app purchase within a given timeframe and its so useful it pinpoints which media sources your quality users are coming from and also helps you measure the performance of your monetization model.
Third is average revenue per user.
ARPU tells you the average revenue generated from a single user over a set period of time that can be via any form of monetization model, such as in app purchases, in app advertising or subscriptions.
Understanding ARPU allows you to re examine the channels, networks and campaigns you’re using so you can keep or remove them based on ROI. And last but not least is lifetime value or LTV.
LTV is similar to ARPU, but it measures the average revenue a user generates over the entire time they use your app rather than within a defined time period.
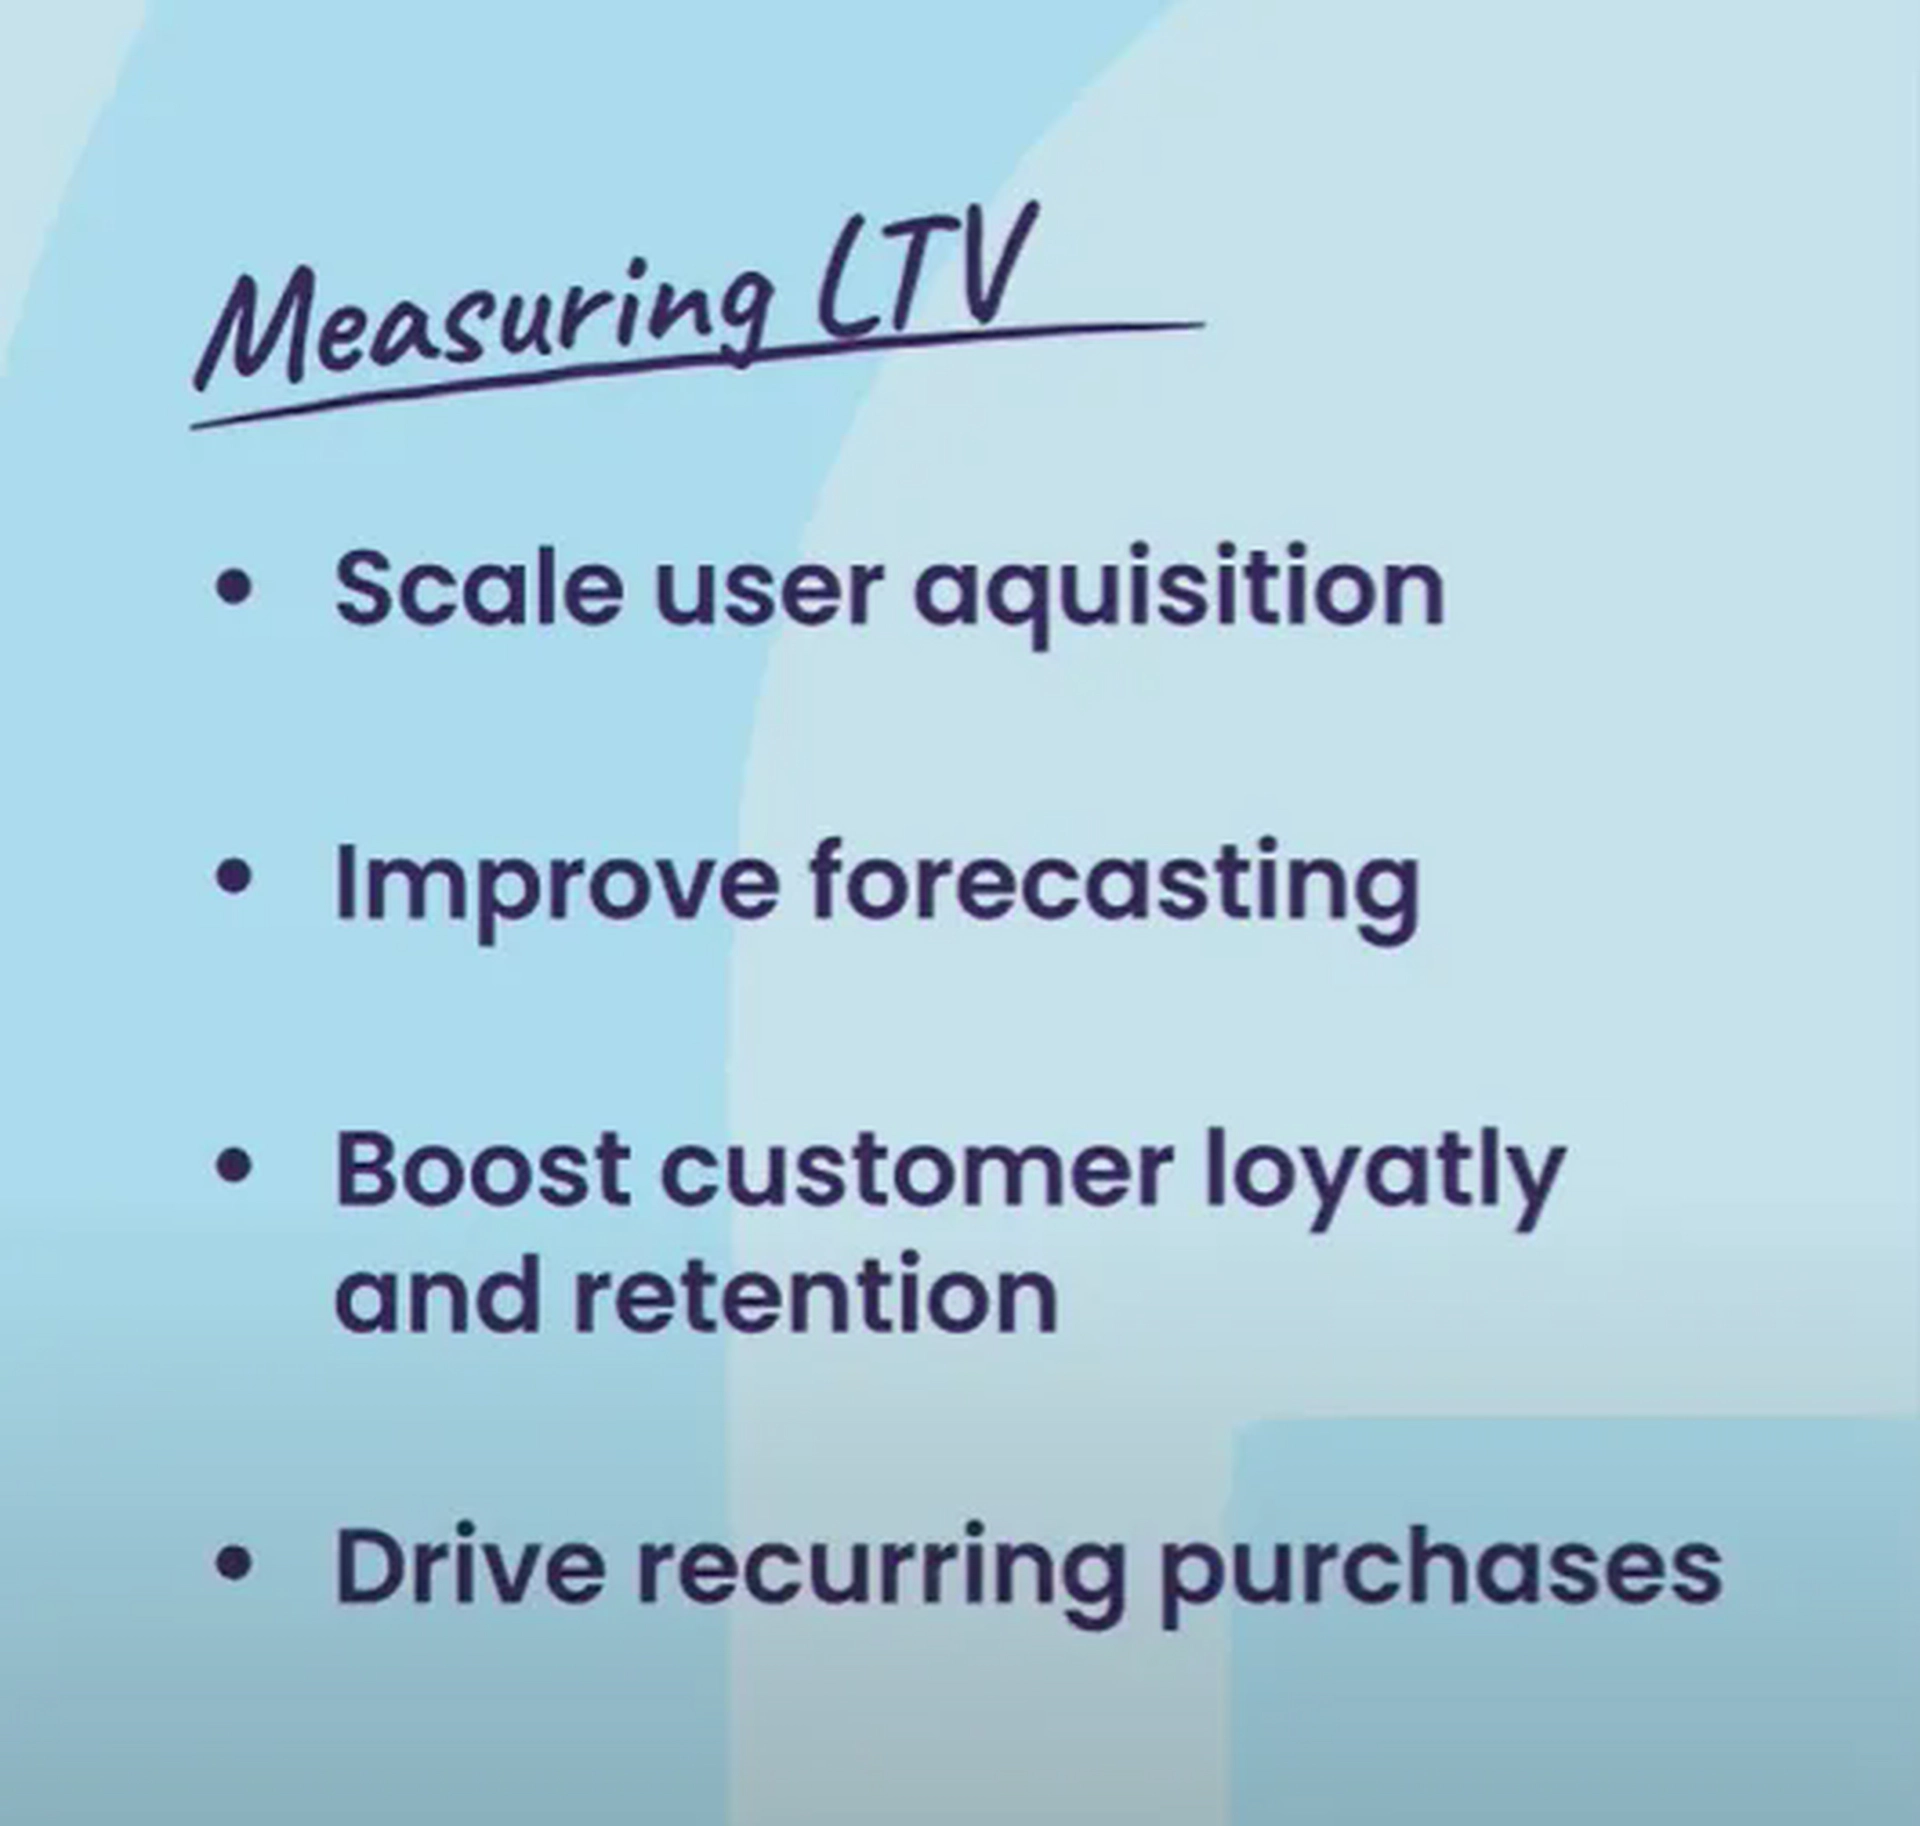
Measuring LTV gives you the ability to scale user acquisition, improve forecasting, boost customer loyalty and retention, and drive recurring purchases.
Basically, it’s key to driving much of your marketing success.
So there you have it, the key app marketing metrics that are going to impact your bottom line.
If you’ve got questions, comment below.
If you enjoyed this article, you can share it with your network. It will only take a few seconds, but it will mean the absolute world to me.
Let’s keep in touch.
Every year, there are new technologies that make a difference in the world. 2024 is turning out to be amazing …

Top 13 Micro SaaS Ideas - Profitable Examples for 2024. That's going to give you some really good inspiration …

Ten B2B SaaS examples that I'm sure you're going to get some amazing inspiration from. For each of these …